content
Global Equity
The NPS invests in a range of equities in the global market, especially listed equities, as part of its investment diversification strategy. Investments in overseas equities are made both internally within its investment universe and through external managers in line with its portfolio management strategy for each sub-asset class.
Overview
(in trillion won, as of the end of Q4 in 2023)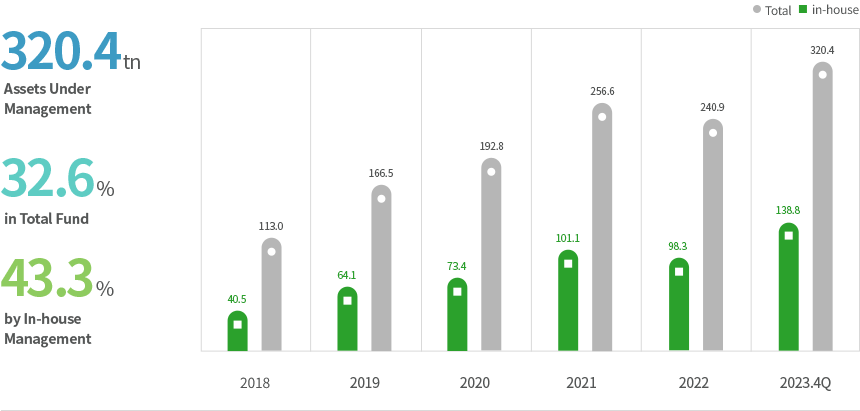
Asset Value Of the Overseas Equities 320.4, Weight in the Total Fund 32.6%, In-house Management Portion of the Overeas Equities 43.3%
| year | In-house | Total |
|---|---|---|
| 2018 | 40.5 | 113.0 |
| 2019 | 64.1 | 166.5 |
| 2020 | 73.4 | 192.8 |
| 2021 | 101.1 | 256.6 |
| 2022 | 98.3 | 240.9 |
| 2023. 4Q | 138.8 | 320.4 |
- Until a fund management assessment is completed, preliminary estimates are provided.
- The figures above might not add up due to rounding.
Sector/Geography Composition
(As of the end of 2022)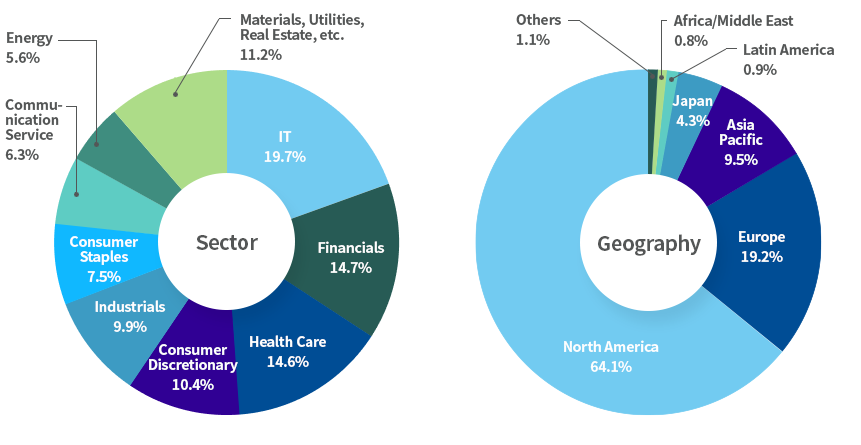
- Data on assets by sector, geography, issuer or type as of the end of the fiscal year is disclosed in the third quarter of the following year according to Article 25 of the Guideline for National Pension Fund Management and Article 39 of the Regulation on National Pension Fund Management.Fund Management and Article 39 of the Regulation on National Pension Fund Management.
- The figures above might not add up due to rounding.
Top10 Holdings
(in 100 million won, as of the end of 2022)| No. | Company | Amount | Weight | Holding |
|---|---|---|---|---|
| 1 | APPLE INC | 74,030 | 3.1% | 0.3% |
| 2 | MICROSOFT CORP | 63,855 | 2.7% | 0.3% |
| 3 | ALPHABET INC CL A | 26,432 | 1.1% | 0.4% |
| 4 | AMAZON.COM INC | 25,673 | 1.1% | 0.2% |
| 5 | UNITEDHEALTH GROUP INC | 25,065 | 1.0% | 0.4% |
| 6 | ALPHABET INC CL C | 22,584 | 0.9% | 0.3% |
| 7 | INVESCO PUREBETA MSCI USA ETF | 22,209 | 0.9% | 80.4% |
| 8 | EXXON MOBIL CORP | 16,809 | 0.7% | 0.3% |
| 9 | JOHNSON + JOHNSON | 16,531 | 0.7% | 0.3% |
| 10 | NESTLE SA REG | 16,094 | 0.7% | 0.4% |
Data on assets by sector, geography, issuer or type as of the end of the fiscal year is disclosed in the third quarter of the following year according to Article 25 of the Guideline for National Pension Fund Management and Article 39 of the Regulation on National Pension Fund Management.