content
Infrastructure
Under the portfolio diversification strategy, the NPS constantly expands its exposure to alternative assets including real estate, infrastructure and private equities, etc.
Overview
(in trillion won, as of the end of Q4 in 2023)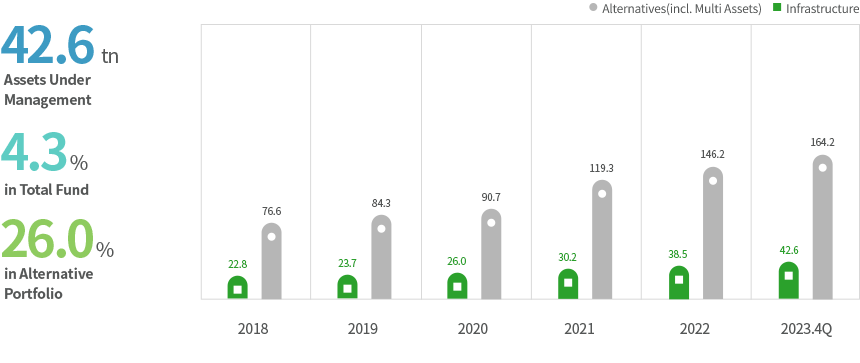
Asset Value of the Real Estate 42.6, Weight in the Total Fund 4.3%, Portion of the Alternatives 26.0%
>| year | Alternatives | Infrastructure |
|---|---|---|
| 2018 | 76.6 | 22.8 |
| 2019 | 84.3 | 23.7 |
| 2020 | 90.7 | 26.0 |
| 2021 | 119.3 | 30.2 |
| 2022 | 146.2 | 38.5 |
| 2023. 4Q | 164.2 | 42.6 |
Note:
- Super-core infrastructure is included.
- Until a fund management assessment is completed, preliminary estimates are provided.
- The figures above might not add up due to rounding.
Type/Geography Composition
(As of the end of 2022)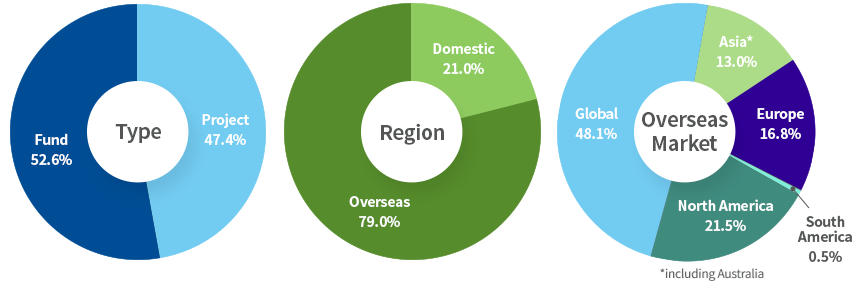
Note:
- Data on assets by sector, geography, issuer or type as of the end of the fiscal year is disclosed in the third quarter of the followingyear according to Article 25 of the Guideline for National Pension Fund Management and Article 39 of the Regulation on National Pension Fund Management.
- The figures above might not add up due to rounding.